SysInfo: what this machine is, and how fast
examples/sysinfo is a system information and benchmarking application in the
interaction grammar of the diagnostic tools of the early 1990s: a desktop of
windows under a menu bar, every figure named, and a bar chart comparing what
was measured against what was published.
It is in this repository for three patterns the other examples do not show:
| Pattern | Where to look |
|---|---|
A second injected platform service, differently shaped from FileSystem | system_probe.hpp, posix_system_probe.cpp |
Long, cancellable work on a worker thread, delivered through Application::post | benchmark_service.cpp |
| Comparative data visualization with a capability-chosen rendering | bar_chart_view.cpp, latency_plot.cpp |
The platform boundary
Everything this application reports about the machine arrives through one interface. No other file in the reporting path includes a platform header, reads the environment, or probes host files. The separately opt-in disk benchmark writes only to the directory the reader chooses and is described under the measurement rules below:
class SystemProbe {
public:
    virtual ~SystemProbe() = default;

    // Cheap and re-readable: the application calls host() and memory() on a
    // refresh timer, so an implementation must not cache them.
    virtual HostReport host() const = 0;
    virtual MemoryReport memory() const = 0;

    virtual ProcessorReport processor() const = 0;
    virtual std::vector<VolumeReport> volumes() const = 0;
    virtual PowerReport power() const = 0;
    virtual BuildReport build() const = 0;
};
PosixSystemProbe implements it for macOS (sysctl, mach, getmntinfo) and for
Linux (/proc, /sys, /etc/os-release). FixedSystemProbe returns a
scripted machine, which is what the tests and the generated screenshots run
against — so every pane renders identically on every host. A Windows probe is
the same shape and belongs to the Windows host package; the application above
the interface does not change when it arrives.
Absence is expressed as absence. A host that cannot answer "how many
physical cores" must not be made to say zero: a plausible wrong number is
indistinguishable from a measurement, and this is a program whose entire
purpose is to be believed about numbers. Every unavailable field reads
not reported.
The panes
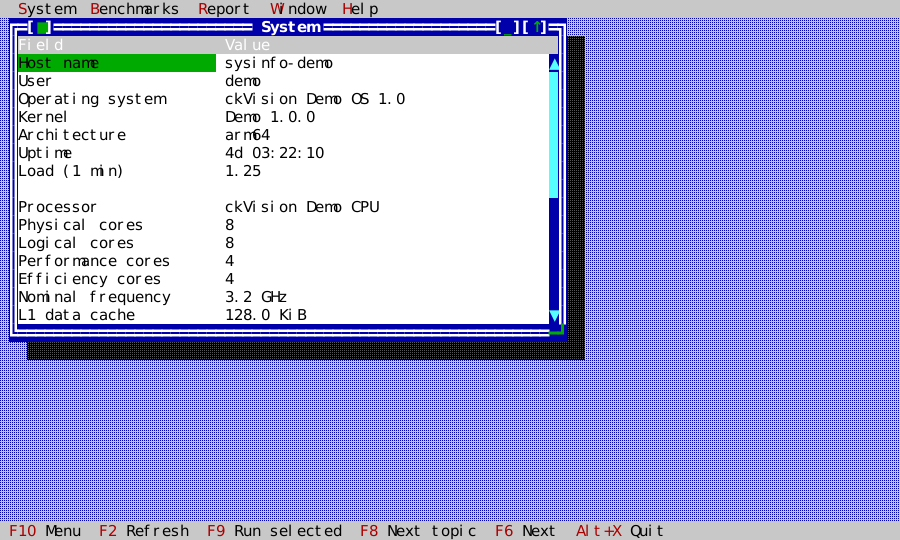
- System — host, operating system, processor, power, and the build's own facts, including which build configuration took the measurements.
- Memory — total and available, then the host's own accounting in the host's own words. Operating systems disagree deeply about what "used" means, so this pane does not translate their categories into a vocabulary it would have had to invent.
- Disks — the volumes a reader means by "disks". The operating system's own
bookkeeping (preboot and recovery volumes, simulator images, container
overlays) is hidden by default, counted in the window's footer, and one
checkbox away. The discriminator is
MNT_DONTBROWSEon macOS — the flag the kernel already keeps for this question — and a stated rule about block devices on Linux. - Terminal — the capability report, the cell metric, and whether this terminal decodes pictures. The one report here that is about the terminal rather than the machine.
- Benchmarks — the chart, described below.
The summary below is the actual application driven against
FixedSystemProbe. The obviously fictional host makes the capture honest: it
is evidence of layout and presentation, never a claim about the machine that
generated this page.
Measurements, and what makes them honest
Six kernels: an integer mix, a naive double-precision matrix multiply, STREAM's
triad, a pointer-chase latency walk, a thread-scaling run, and a disk
write/read. The first five are functions over memory owned by the run, which is
why their answers can be tested independently of their speed —
integer_mix(seed, 2) against the xorshift and fold worked out by hand, the
multiply against identity and a 2×2 done on paper, and the triad against its
arithmetic. The disk path is deliberately different: its negative test proves
that an empty directory selection performs no I/O, while interactive storage
measurement remains explicit and opt-in.
Four rules hold everywhere in the example, and each is enforced by a test:
- No test asserts a score. A benchmark number is a fact about a machine's afternoon — its thermal state, its power source, what else is running. The suites assert what the kernels compute, that progress advances, and that cancel stops a run.
- The scale is stated where the bars are. Each metric's group heading names its own 1.0 ("Disk throughput — index, 1.0 = 100 MB/s"), because one caption can only name one scale.
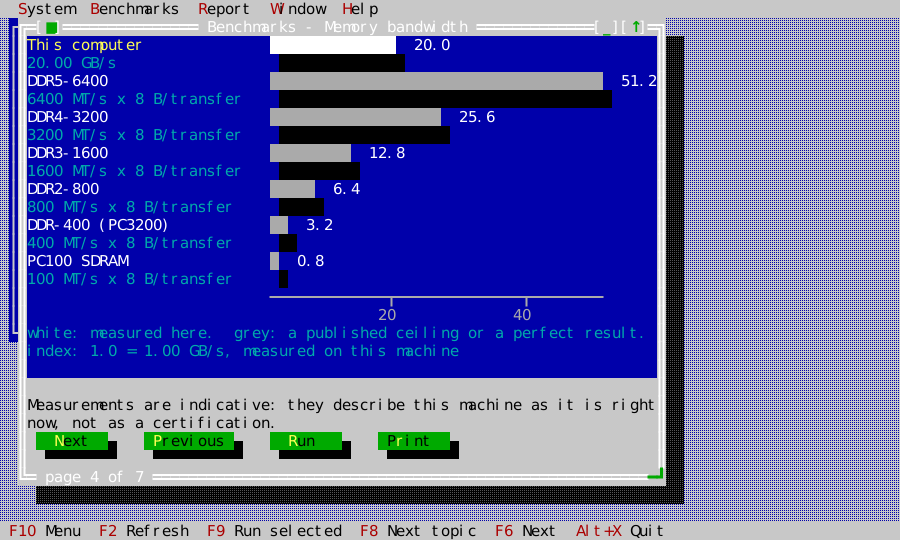
- A bar this program did not measure is drawn in different ink. Measured
bars are solid and drawn to an eighth of a cell; published ceilings are
shaded and drawn in whole cells, because a figure computed from a standard
is exact to the standard and to nothing finer. Every reference row carries
its arithmetic and its source —
DDR4-3200,3200 MT/s × 8 B/transfer,JEDEC DDR4 (JESD79-4)— and the test redoes the arithmetic rather than pinning the number. A kernel with no published figure, such as this program's own integer mix, has no comparison bars at all. - An unoptimized build says so.
CKV_SYSINFO_BUILD_TYPEarrives from CMake; a Debug build marks every bar it measured with an asterisk and answers it under the chart. On the machine this was written on, the same code scores between 3.7× and 12.8× lower unoptimized.
The comparison page puts a measured memory-bandwidth result and published
interface ceilings on the same metric-specific scale. The solid and shaded
bars, their legend, and their arithmetic are generated from the same
BenchmarkResult and ReferencePoint values that the report exporter uses.
The disk kernel is the only one that writes to the reader's machine. It says how much it will write, asks where, writes nothing until it has an answer, and removes what it wrote from a destructor so a cancelled run leaves nothing behind. What it does not do is stated in its help topic: it does not defeat the page cache, which needs a different platform call on every platform.
Two renderings of one data set
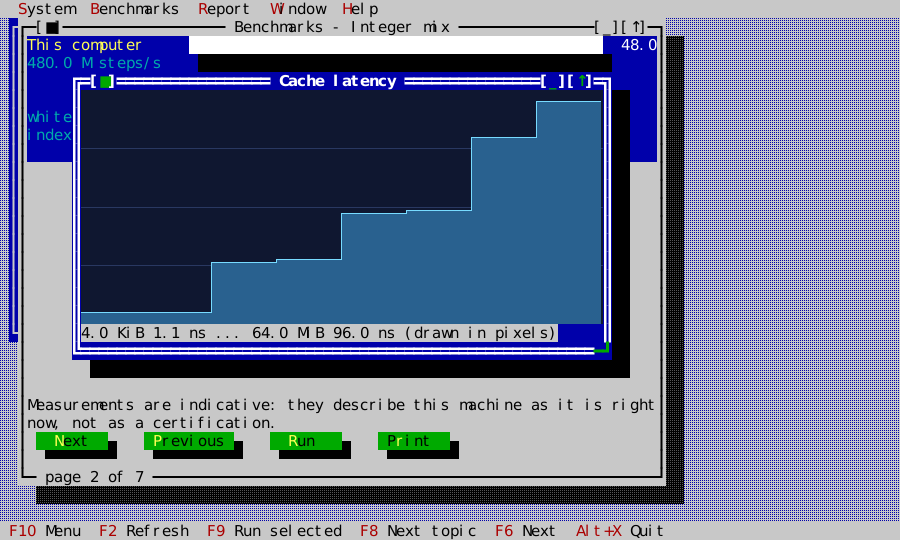
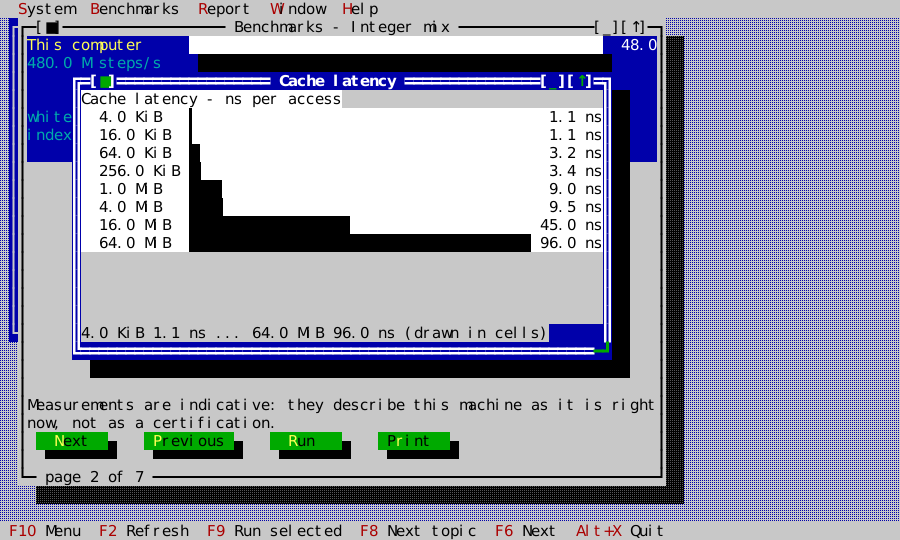
Where the terminal decodes pictures, the cache-latency curve is drawn into a
Canvas on a logarithmic axis; where it does not, the same series is drawn as
cell bars — by the same row composition the chart uses, so the two cannot
diverge. It is one widget with a mandatory fallback rather than a choice
between two widgets made once at construction, because a terminal's answer
about graphics can change while an application is running:
auto canvas = std::make_unique<widgets::Canvas>();
// Canvas never asks the terminal for its cell metric itself; the owner
// injects it (D-039), which is what keeps the picture's proportions
// right on a terminal with tall thin cells and on one with square ones.
canvas->set_cell_metrics(app_.terminal_cell_pixels());
canvas->set_draw_callback([this](Image& image) { draw_latency_plot(image, latency_series()); });
const ui::RoleId fallback_role = app_.roles().find("ckv.list.normal");
canvas->set_fallback_painter([this, fallback_role](scene::Painter& painter, Rect area) {
    const Style style = app_.theme().resolve(fallback_role);
    const std::vector<std::string> rows = chart_rows(latency_bars(), area.width);
    for (int row = 0; row < area.height && static_cast<std::size_t>(row) < rows.size(); ++row)
        painter.draw_text(Point{0, row}, rows[static_cast<std::size_t>(row)], style);
});
canvas->set_help_context_key("sysinfo.latency");
latency_canvas_ = canvas.get();
column->add_item(std::move(canvas), ui::LayoutSpec{ui::SizePolicy::Expanding});
The two captures below run that exact view tree and scripted latency series. Only the terminal capability profile differs.
| Sixel-capable terminal | Cell fallback |
|---|---|
 |  |
Reports and contextual help
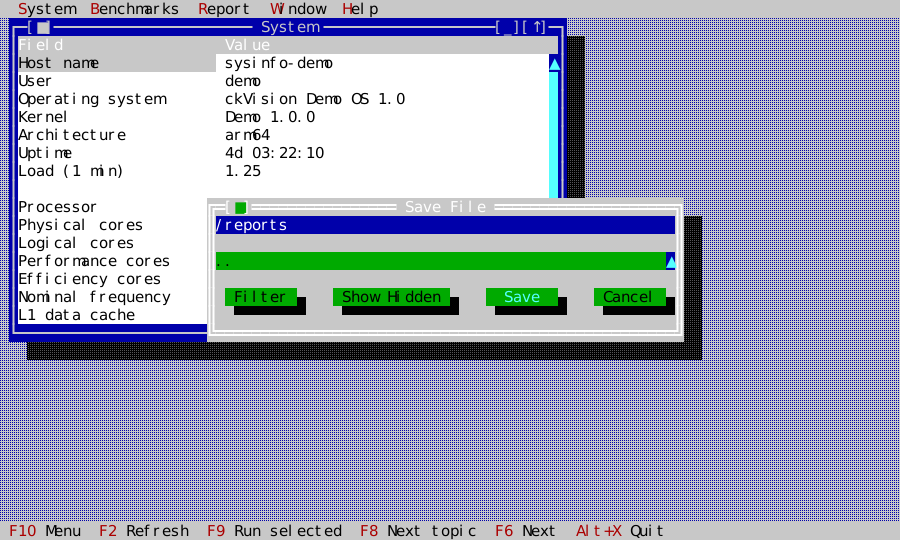
Report presents the ordinary injected-filesystem save dialog. The generated
text and Markdown documents contain the System, Memory, Volumes, Terminal, and
Measurements sections, including every displayed absence and the provenance
of every comparison figure. save_report() writes through FileSystem; the
tests read the result back from MemoryFileSystem, byte-for-byte against
report_text(). One of them does it entirely through the terminal: it opens
Report → Save as text... by its mnemonics, walks into a directory and back out
of another with the arrow keys and Enter, types a file name onto the path the
field shows, accepts, and dismisses the "Report saved" notice, after which the
focus is back where it was.
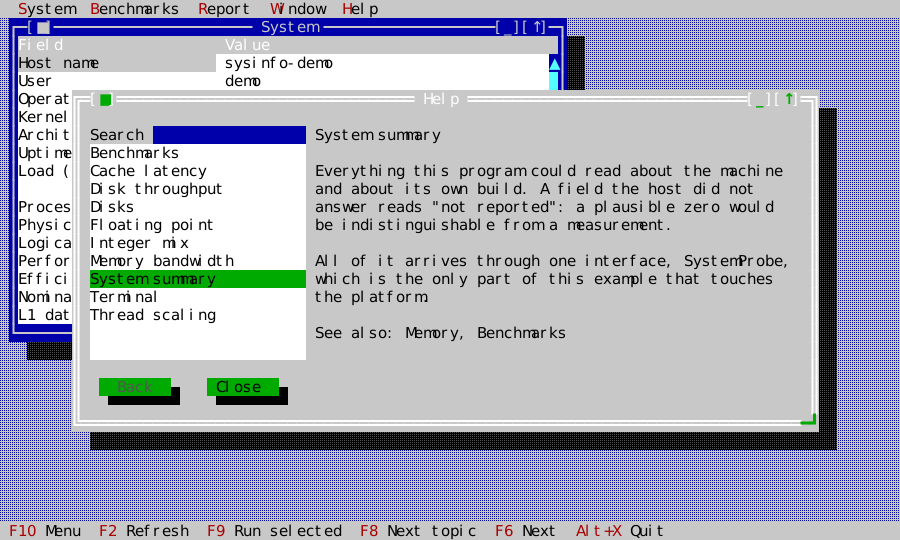
F1 resolves from the focused pane's help_context_key(). Every pane and every
benchmark has its own topic explaining what the number means, what it does not
mean, and what changes it. The topic registry is built beside the pane and
benchmark definitions, and the report suite enumerates the benchmark catalogue
to prove that no topic silently becomes “Not Found.”
Running it
cmake -S . -B build -DCKVISION_BUILD_EXAMPLES=ON -DCMAKE_BUILD_TYPE=Release
cmake --build build --target ckvision_sysinfo
./build/examples/ckvision_sysinfo
Build it Release. A Debug build measures the compiler.
F10 opens the menu, F9 runs the selected benchmarks, Esc cancels a run,
F1 explains the pane under the cursor, and Report writes everything on
screen to a text or Markdown file through the injected filesystem.
What is verified, and how
| Suite | What it holds the example to |
|---|---|
test_sysinfo_format.cpp | units, rounding, the 1024.0-KiB carry, and the absence rule |
test_sysinfo_smoke.cpp | the panes against the scripted machine, the refresh timer, cancellation, the mount filter, and the pixel path on a Sixel profile |
test_sysinfo_benchmark.cpp | each kernel's answer, the worker's delivery, and deterministic cancellation |
test_sysinfo_analysis.cpp | the pointer chase is a single cycle, and the plot draws its own data |
test_sysinfo_chart.cpp | bar geometry, per-group normalization, and the two inks |
test_sysinfo_reference_points.cpp | every published figure, by redoing its arithmetic |
test_sysinfo_report.cpp | the exported report and the help topics |
test_posix_system_probe.cpp | the real probe's internal consistency — never a value |
The benchmark progress display uses ProgressModel and ProgressView: the main
row measures completed tests and its child shows the current operation with an
unknown total. Completion and cancellation are explicit for both rows.